

Empower your industrial operations with clear, impactful visualizations tailored to your needs. Our data visualization services translate complex datasets into intuitive dashboards and reports, enabling informed decision-making and operational efficiency.
Visualize data from multiple systems seamlessly. We combine information from ERP, MES, IoT, and other sources into unified, meaningful representations, ensuring a comprehensive view of your industrial ecosystem.
Gain real-time insights with customized, interactive dashboards. Designed for industrial environments, our dashboards present production metrics, equipment performance, and operational KPIs in a visually engaging and easily accessible format.
Stay ahead of potential disruptions with predictive analytics. We create dynamic visualizations that highlight trends, forecast outcomes, and reveal actionable insights, helping you optimize processes and mitigate risks.


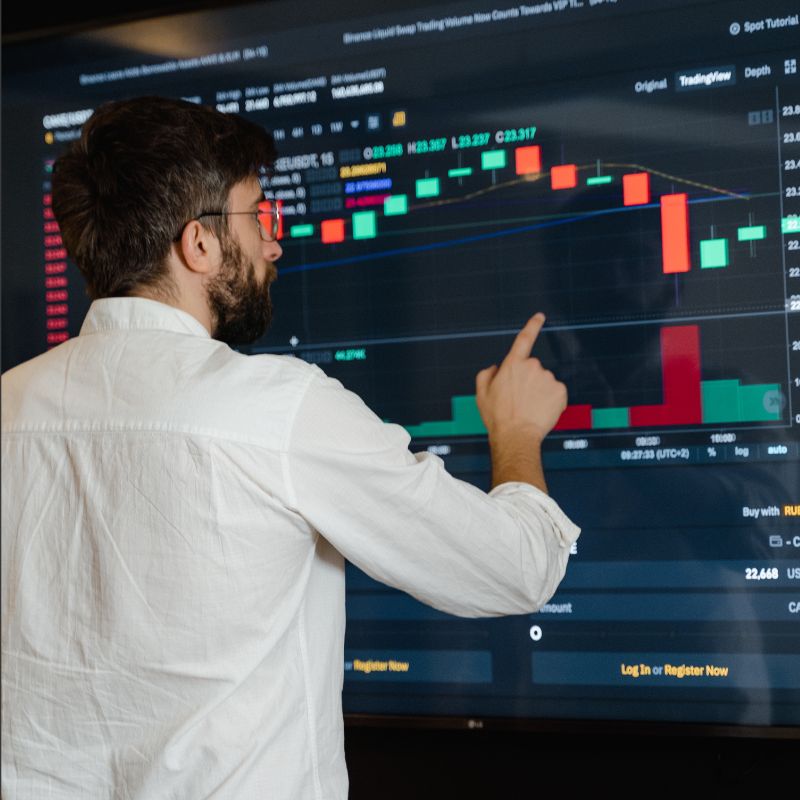
Our data visualization solutions are crafted to address the unique challenges faced by industrial businesses. Whether it’s optimizing processes, monitoring performance, or making data-driven decisions, we ensure your data tells a story that’s easy to understand and act upon.
Yes, we specialize in customizing visualizations to suit your operations, whether it’s real-time equipment monitoring, production efficiency tracking, or supply chain analytics.
We integrate directly with your data sources, apply rigorous validation processes, and build real-time sync capabilities to ensure your visualizations reflect accurate and up-to-date information.
We use leading tools like Tableau, Power BI, and custom frameworks tailored to industrial needs. Our approach ensures flexibility, scalability, and seamless integration with your existing systems.

Copyright datatika All Rights Reserved by DATATIKA